
Getting Started (InfluxDB - Grafana - Docker)
Why
I don't know about everyone else, but it seems like I find a analytics problem at least once a week that could use a simple clean graphing tool. Using Docker.io, which is amazing, I was able to setup a very simple local environment to graph several thousand data points using a clean interface in the amount of time it took my slow internet connection to download the docker containers. So without further distraction I'll show you what I did.
Run Docker Containers
- Startup the influx db container from a shell
docker run -d -p 8083:8083 -p 8086:8086 --expose 8090 --expose 8099 tutum/influxdbNotice that two ports are exposed to the host machine.
8083 (influx admin port), 8086 (influx data port)
Access http://localhost:8083, login with root/root, and create a database called mydata. You can use all the default options for our purposes .
Startup the grafana container from a shell
docker run -d -name grafana -p 8080:80 -e INFLUXDB_HOST=localhost -e INFLUXDB_PORT=8086 -e INFLUXDB_NAME=mydata -e INFLUXDB_USER=root -e INFLUXDB_PASS=root tutum/grafanaNotice that port 8080 (grafana web ui) is exposed to the host machine
Load InfluxDB with Data
Loading influx with data is extremely easy using the influx api libraries. In particular I've used the python and nodejs libraries. Here is an example of loading points in python.
Create a new connection to influxdb which is extremely simple. You need the influxdb package installed. easy_install on my mac worked great.
from influxdb import client as influxdb
influx = influxdb.InfluxDBClient("localhost", 8086, "root", "root", "mydata")
Insert some points
# An empty array to store data to avoid making multiple calls to influx.
data = []

for (time, amount) in fetchedData:
  data.append({
    'points': [[mktime(time.timetuple()),amount]],
    'name': 'awesomedata',
    'columns': ['time', 'amount']
  })

# Write the points to influx
influx.write_points(data)
In the above code the "fetchedData" variable is just a dataset from a mysql db. If you'd like more information on building a dataset send me a message, and I'll help out.
View Data Using Grafana
If you made it this far you probably realized that I typed a lot more than I needed to. InfluxDB is running, it contains some time series data, and you are ready to see some graphs. Grafana makes graphing extremely easy when you have a backing influx data store. Influx provides the engine, and grafana provides the interior of the vehicle.
To use grafana to see your data, access http://localhost:8080 and login as admin with a password of... oh, right we need to find the password from the docker logs of the grafana container. To get the password which is generated each time a new container is built simply execute the following in a shell.
docker logs grafanaThe password will be listed.
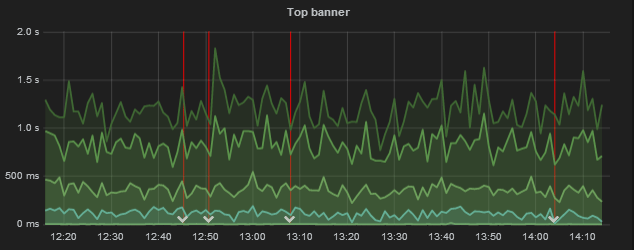
Now that you are logged into grafana, and have a complete InfluxDB/Grafana/Python script setup, you can use the basic getting started grafana info to build some graphs. They are really beautiful!
The only thing you need to change in the examples is the data source from graphite to influx. See the getting started doc @ http://grafana.org/docs/features/intro/
Good luck graphing!
tutum.co
In my opinion tutum.co has some of the best docker containers around. Their documentation is complete, and easy to read. Check out the two containers I used above if you'd like to get more information on using docker links rather than the port mappings.
https://registry.hub.docker.com/u/tutum/influxdb/
https://registry.hub.docker.com/u/tutum/grafana/
Written by Matt Conroy
Related protips
1 Response

Hi Matt.
Great article! Do you know if it's possible to view more than one InfluxDB database (on the same host) with one Grafana instance? I'm also using the tutum/grafana docker.
Stefan


